
The Overview screen gives a quick look into your income and expense documents, document review statuses, profit & loss, and so on, to help you in your daily work. In the web app, click Overview in the menu on the left. In the mobile app, the Home tab shows the same kind of figures: Cash Flow, Profit & Loss and Spending breakdown.
To print the Overview or save it as a file, click Export at the top. See Print or export the Overview below.
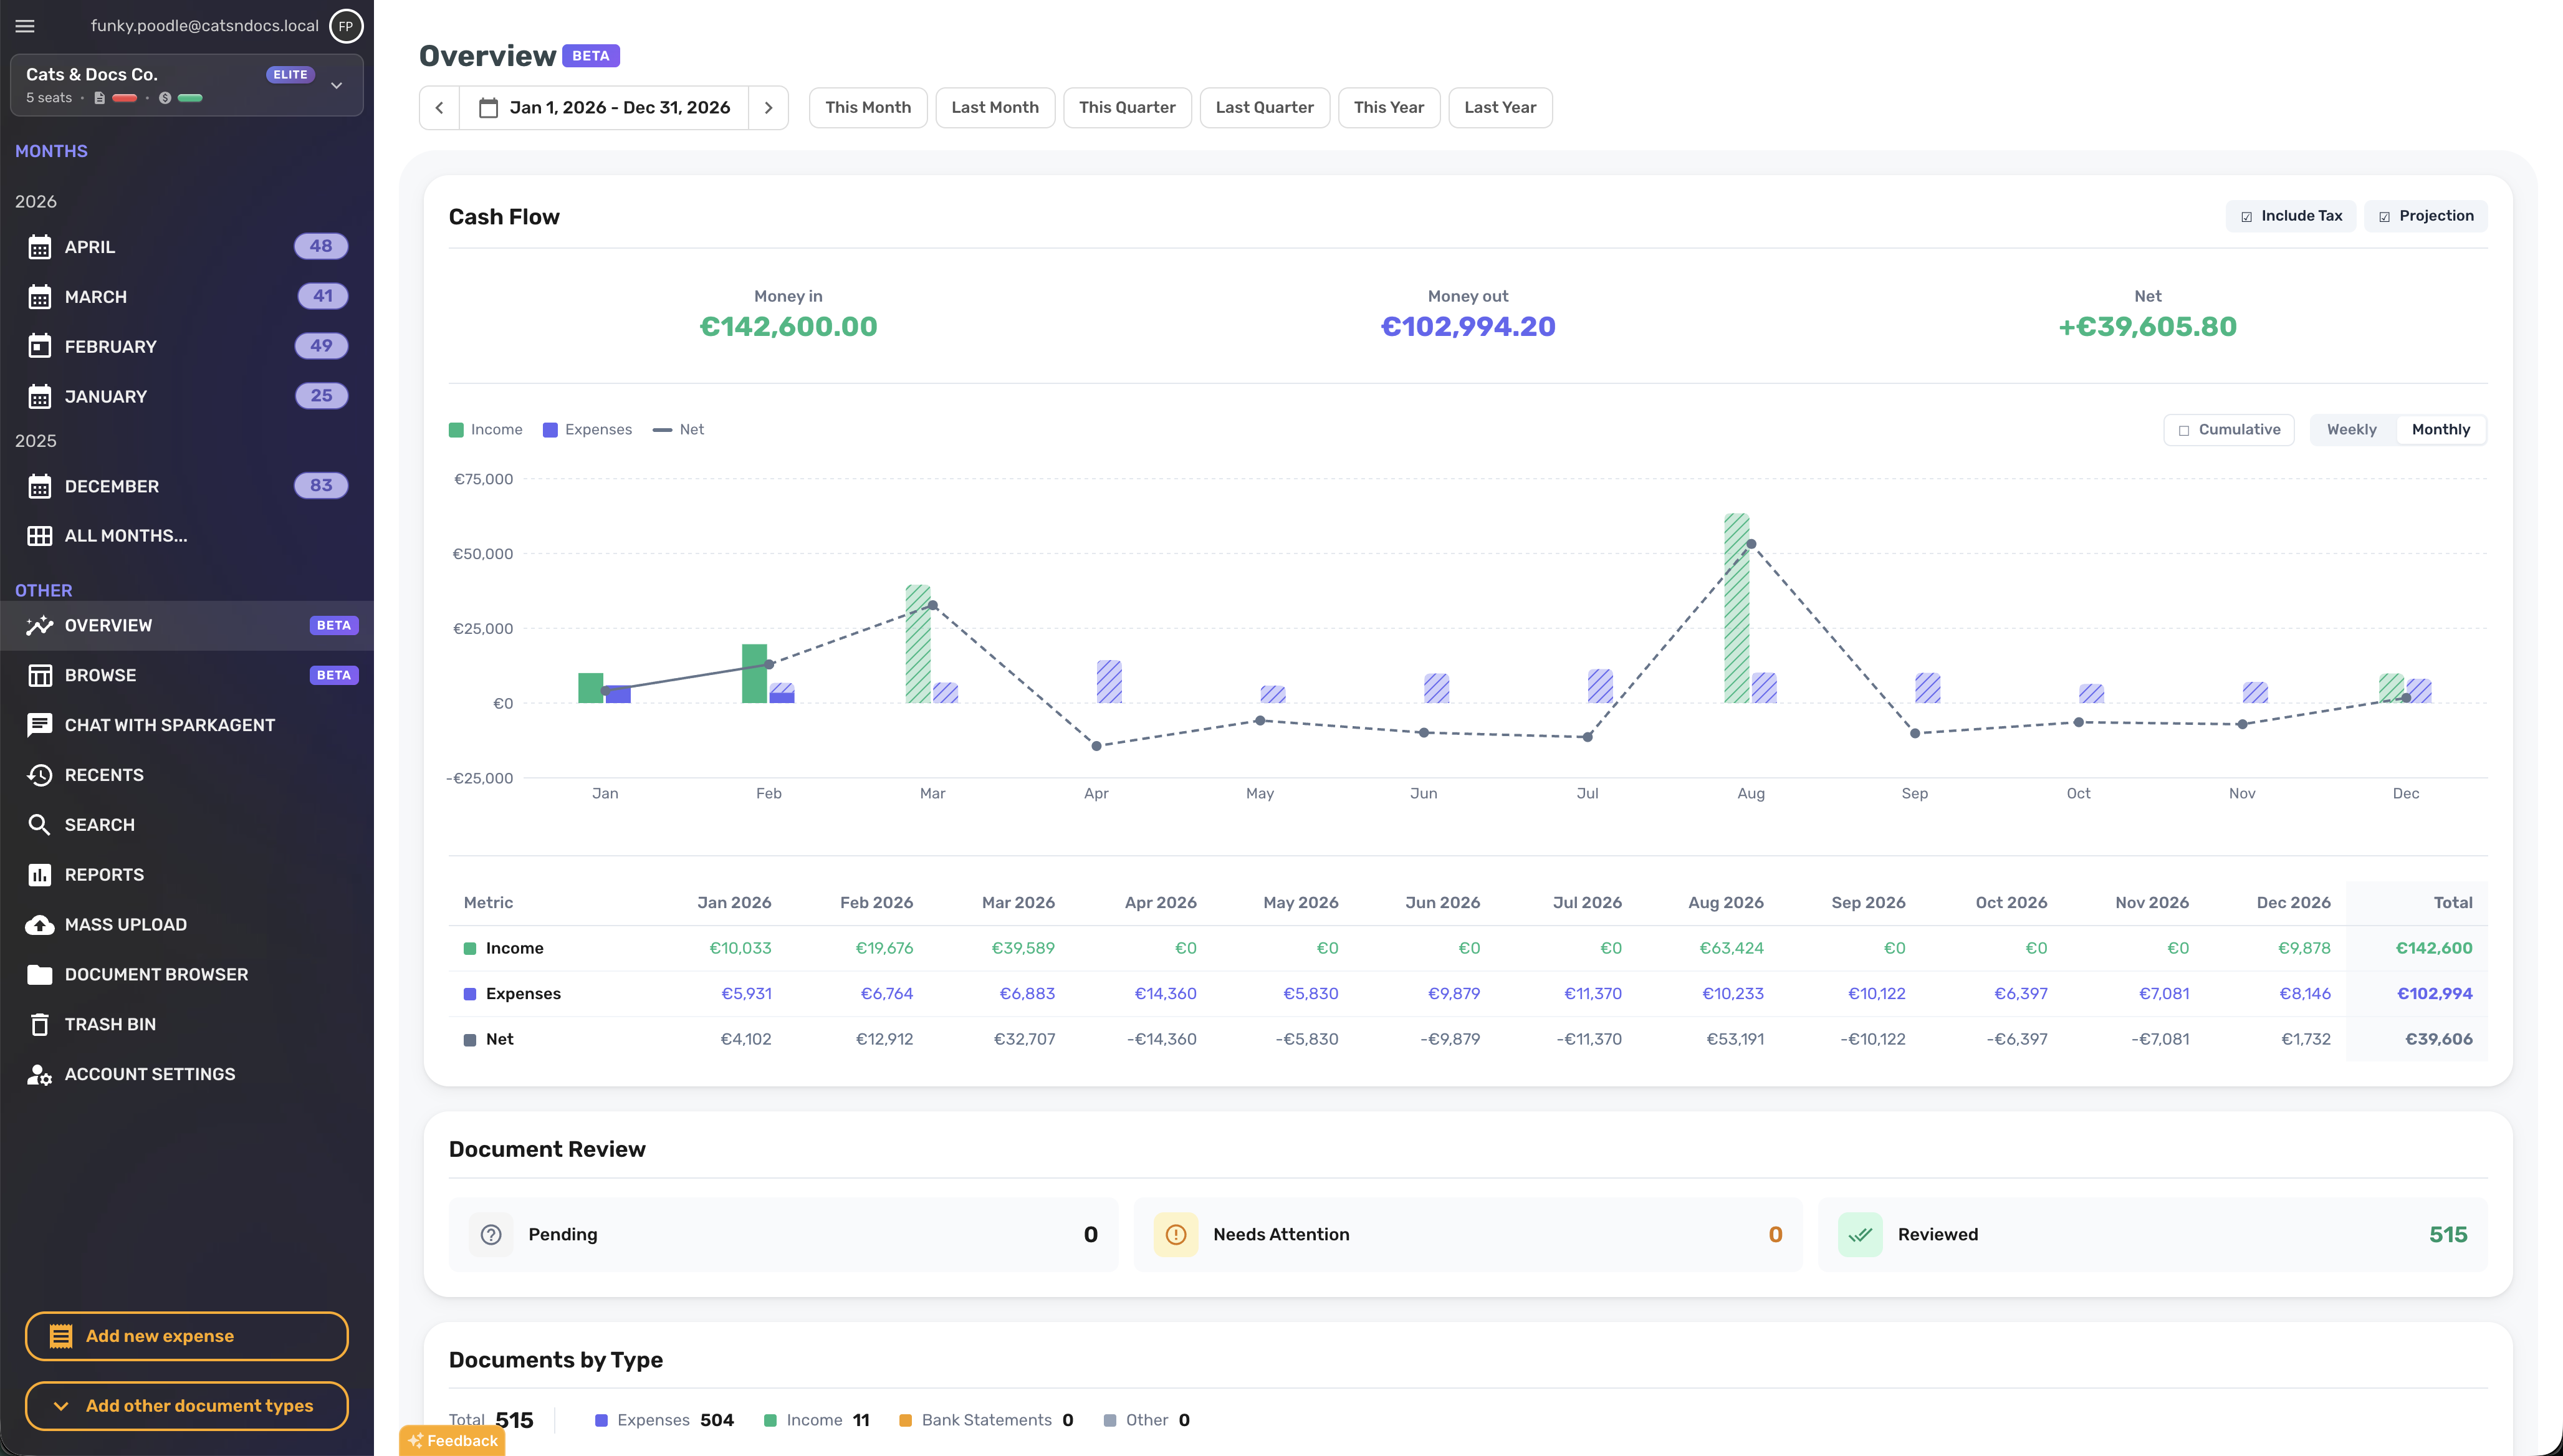
Choose the period
All widgets use the same date range, set at the top of the page.
- Click the date range to open the calendar. Pick a preset (Today, This Week, Last Week, This Month, Last Month, This Quarter, Last Quarter, This Year or Last Year) or select your own start and end dates. A range can be up to five years long.
- Use the arrows on either side to step to the previous or next period. With a month selected, the arrows move one month at a time, and with a year selected, one year.
The Overview opens on the current calendar year. There is no setting for a different default, such as a financial year from July 1 to June 30. The dates you pick are part of the page address, so you can pick your financial year once and bookmark the page. Opening the bookmark shows the Overview with those dates.
In the mobile app, tap the time period on the Home tab to choose This month, Year to date, This year, Custom range or Jump to month.
Look at one month, or months side by side
- To see a single month, choose This Month or Last Month and use the arrows to move between months. In the mobile app, use Jump to month.
- To compare months, choose a longer range, such as This Year, and set the Cash Flow chart to Monthly. Each month gets its own income and expense bars, and the table under the chart lists every month's figures.
- To browse the documents of one month in the web app, use Months in the menu on the left.
Widgets
The Overview screen has several widgets. All widgets use the same date range defined at the top level for filtering the data.
Cash Flow widget
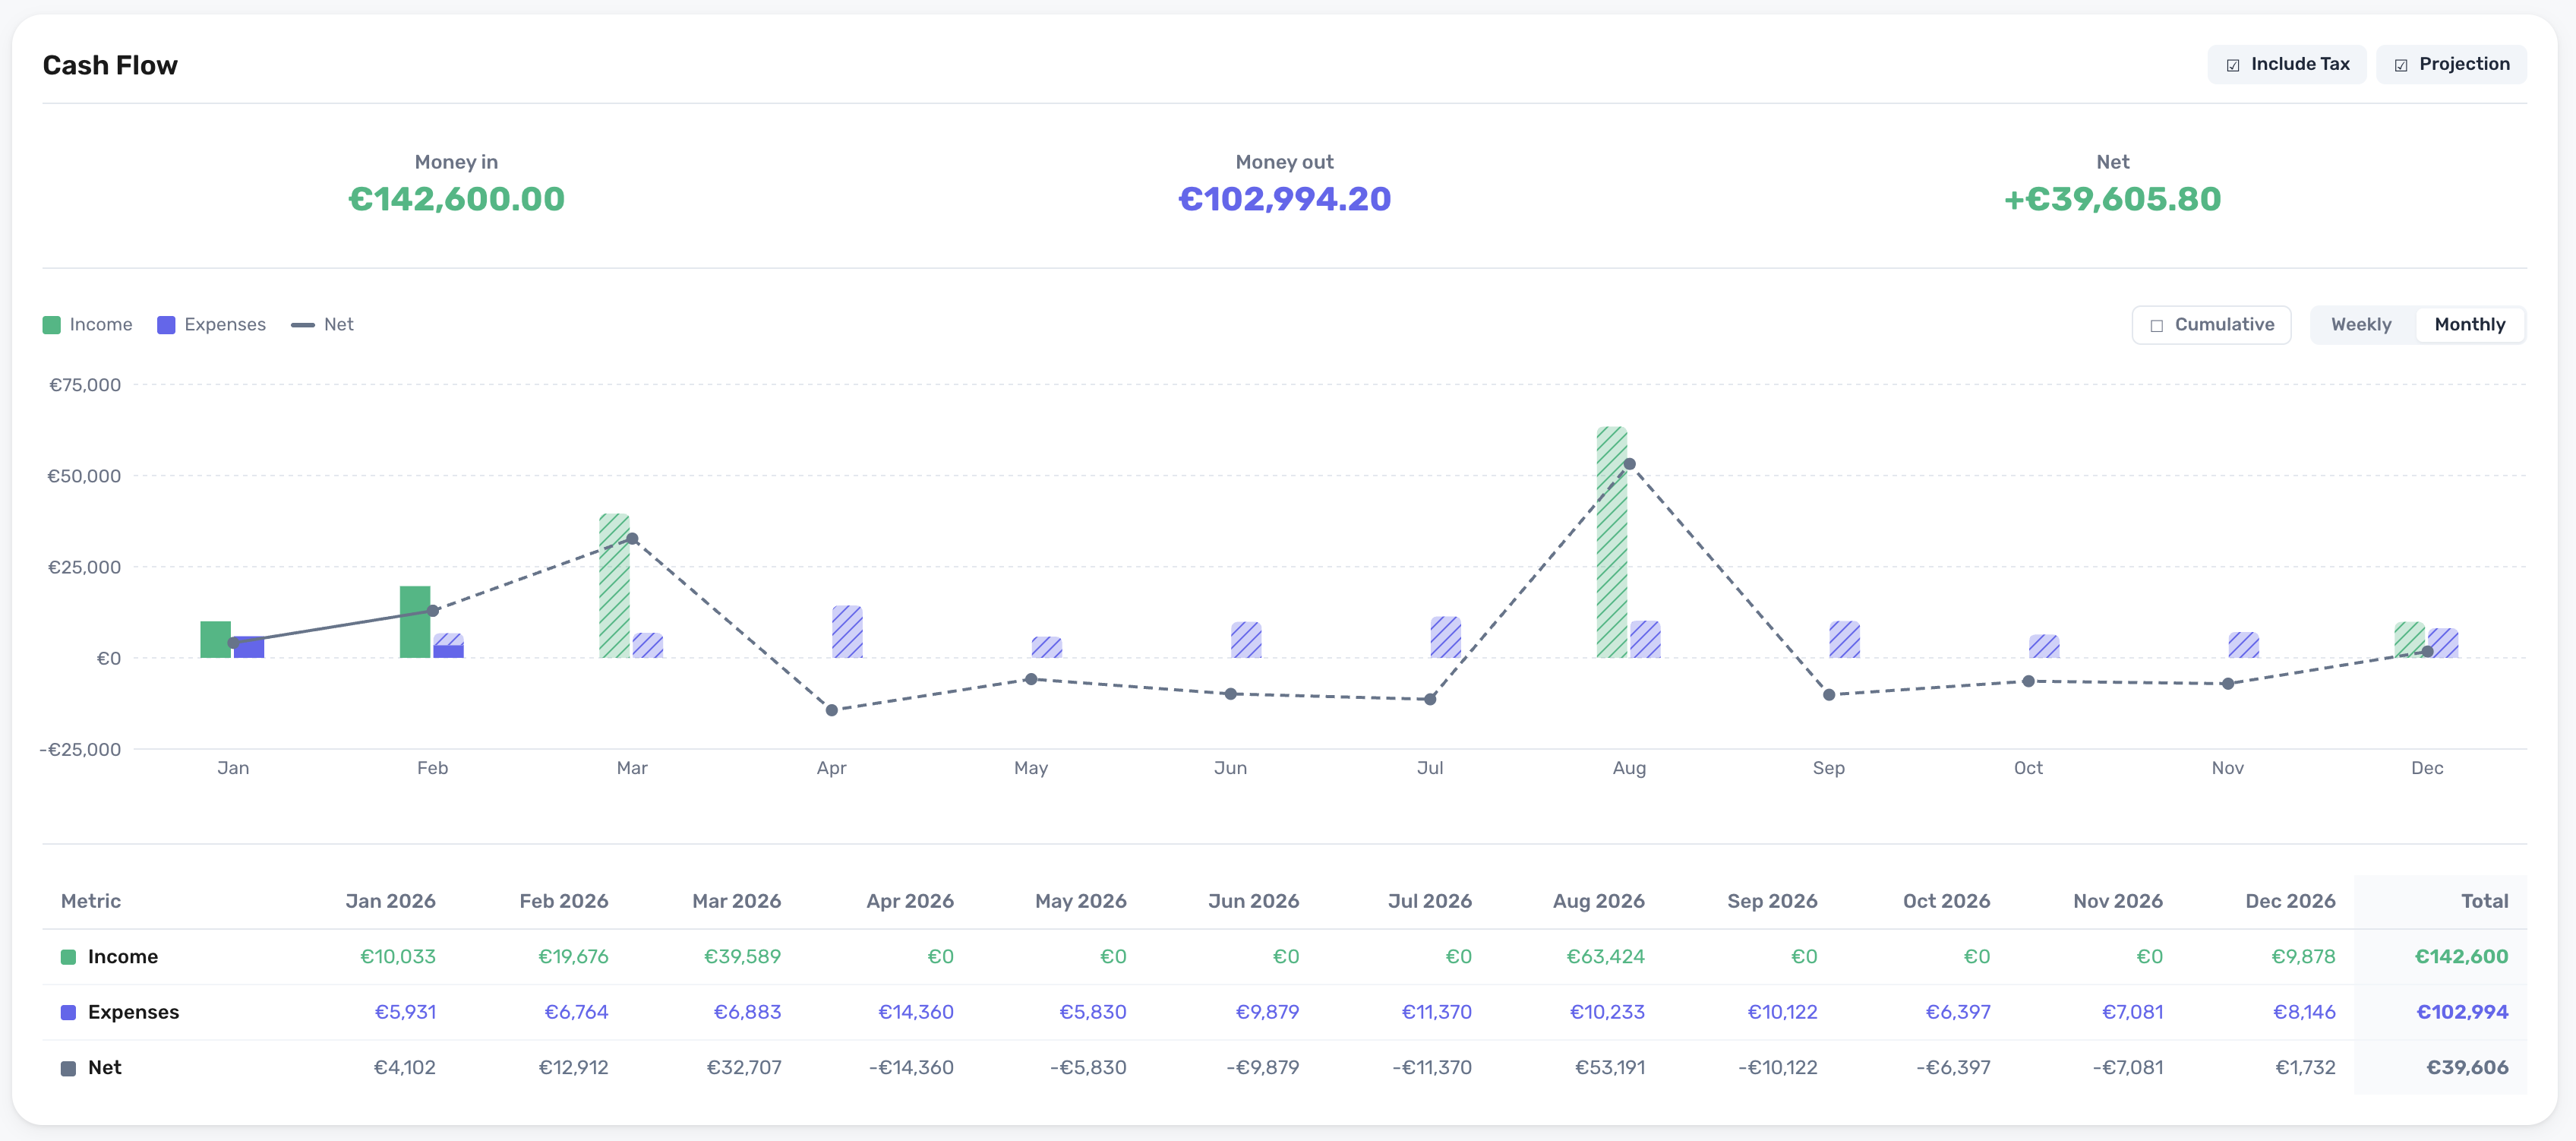
The Cash Flow widget shows your expenses, income and net over time in the selected date range.
The chart has several modes:
-
Include Tax: include or exclude taxes from the shown values.
-
Projection: include future expenses and income from your recurring automations. See Projections from recurring automations.
-
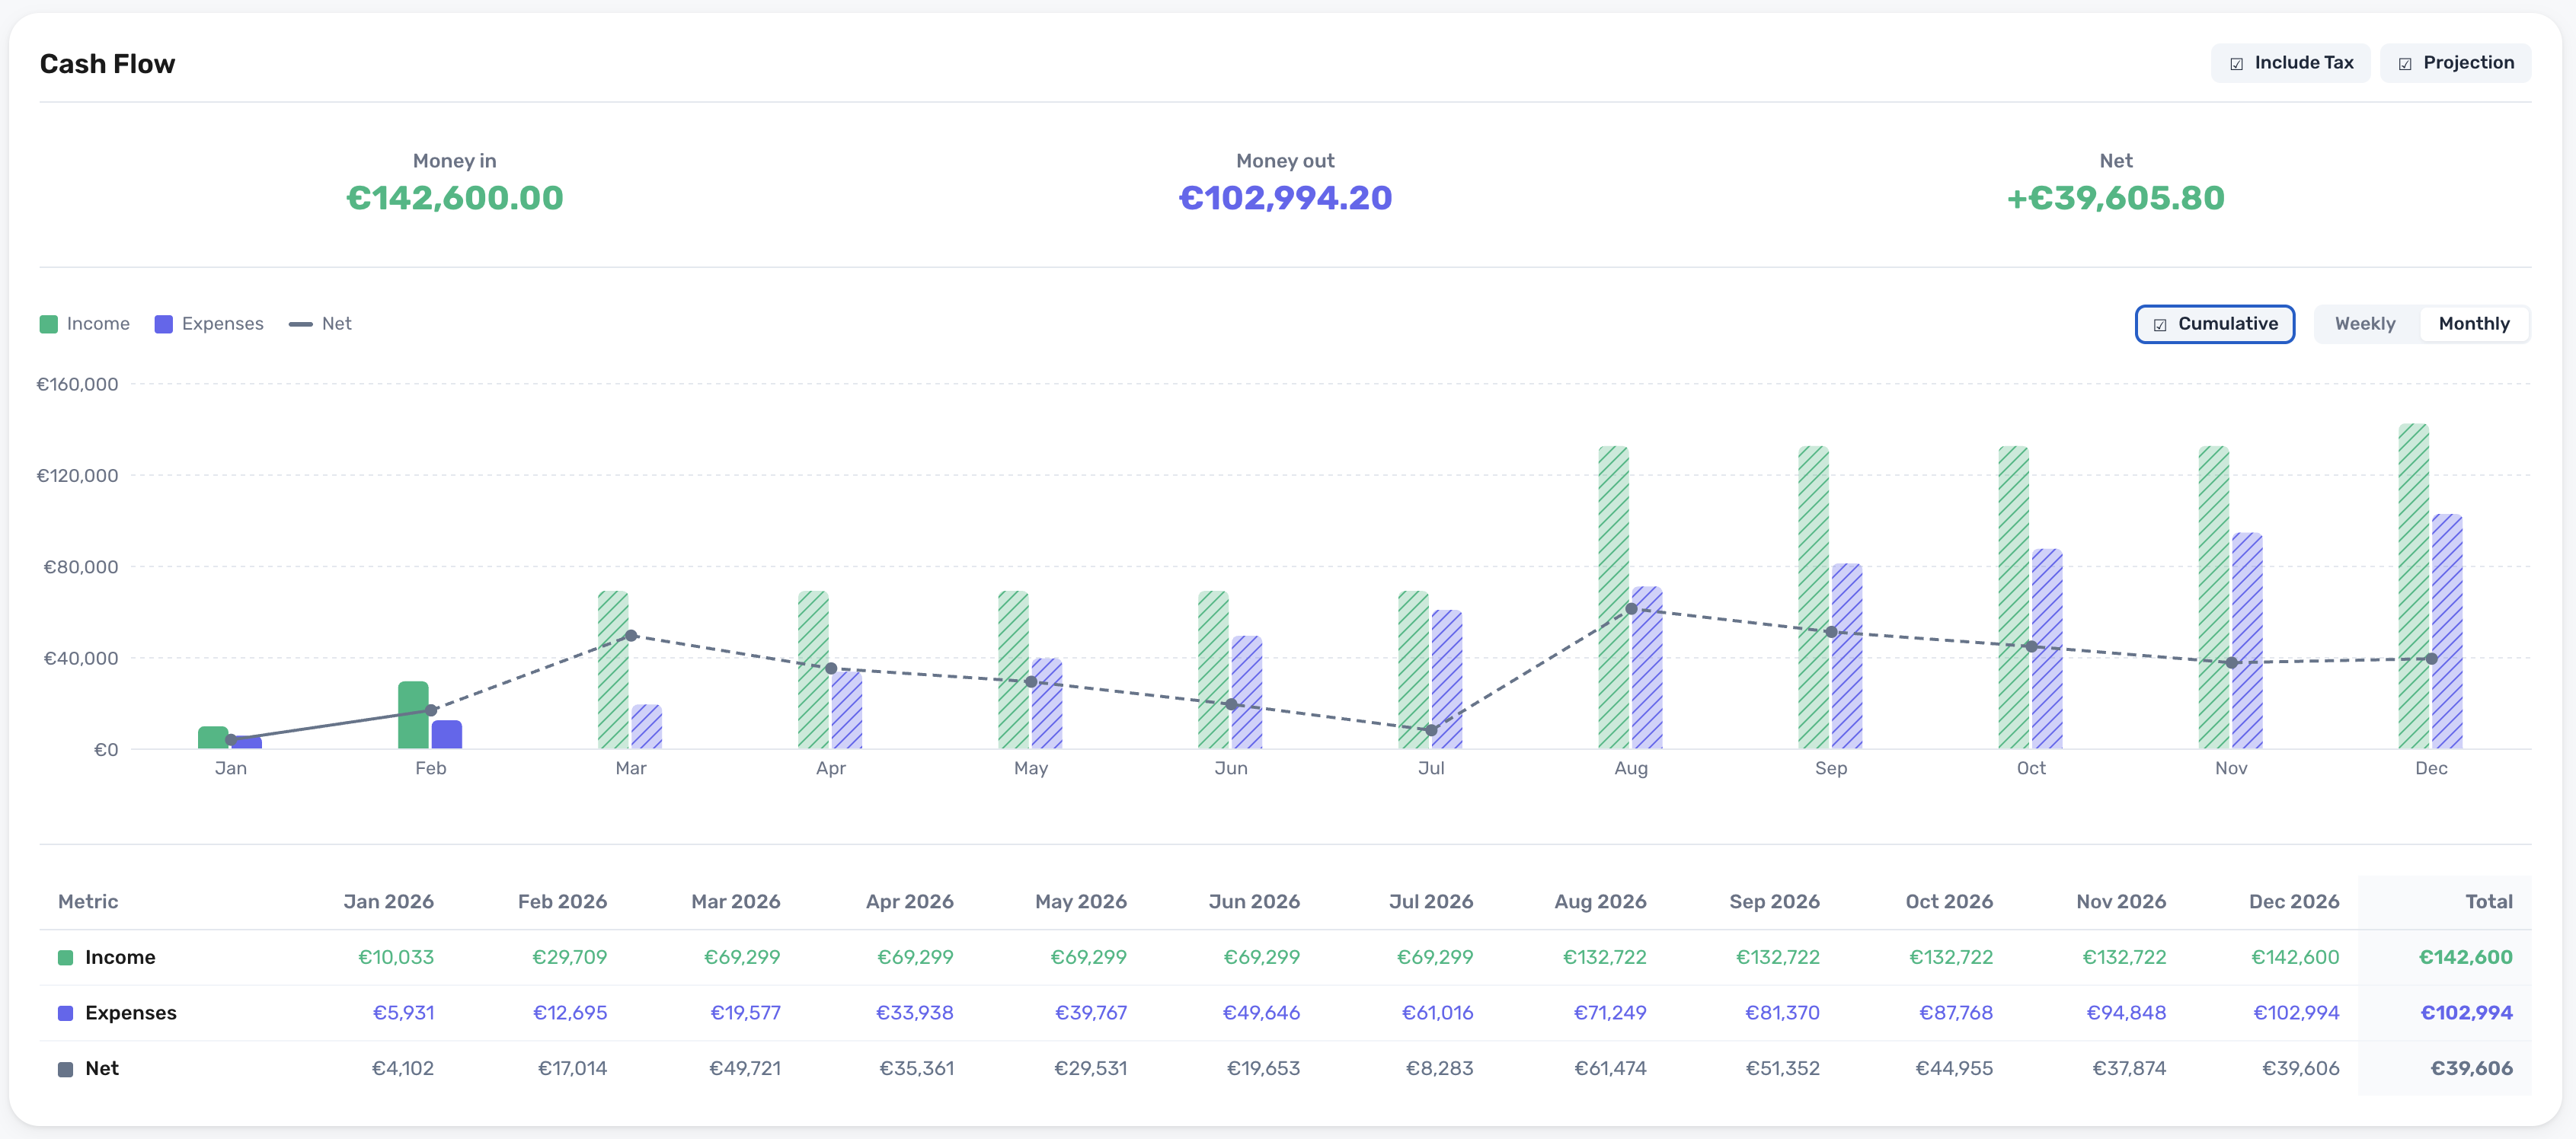
Cumulative: shows cumulative values (a running sum). Helps in e.g. understanding how your P&L progresses over time.
-
Weekly / Monthly: shows data on a weekly or monthly basis.
Cash Flow widget – Default mode
Cash Flow widget – Cumulative mode
Document Review widget
Shows actionable buttons to e.g. quickly view the documents that require attention or are pending for review in the selected date range.
Clicking any of the document review states shows the matching documents in the Browse view.
All documents reviewed:

Some pending documents in the selected date range – click the Pending button to start reviewing them:

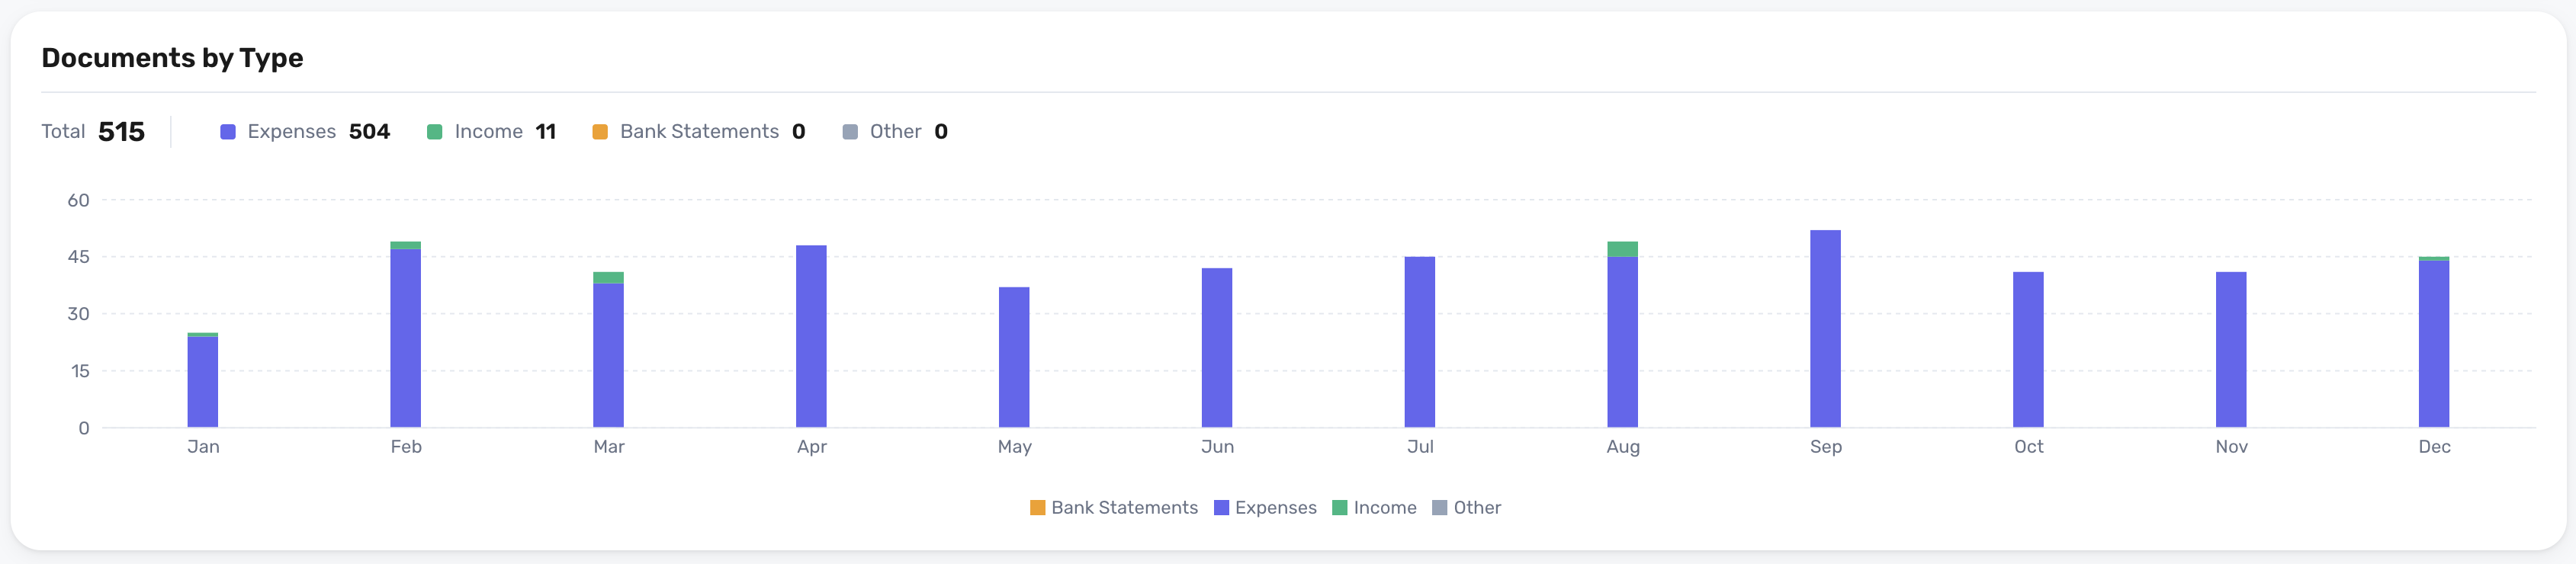
Documents by Type widget
Shows what kind of documents you have added in the selected date range. Useful for spotting e.g. missing expense, income or statement documents by looking at the numbers.
Profit and Loss widget (P&L, PnL)
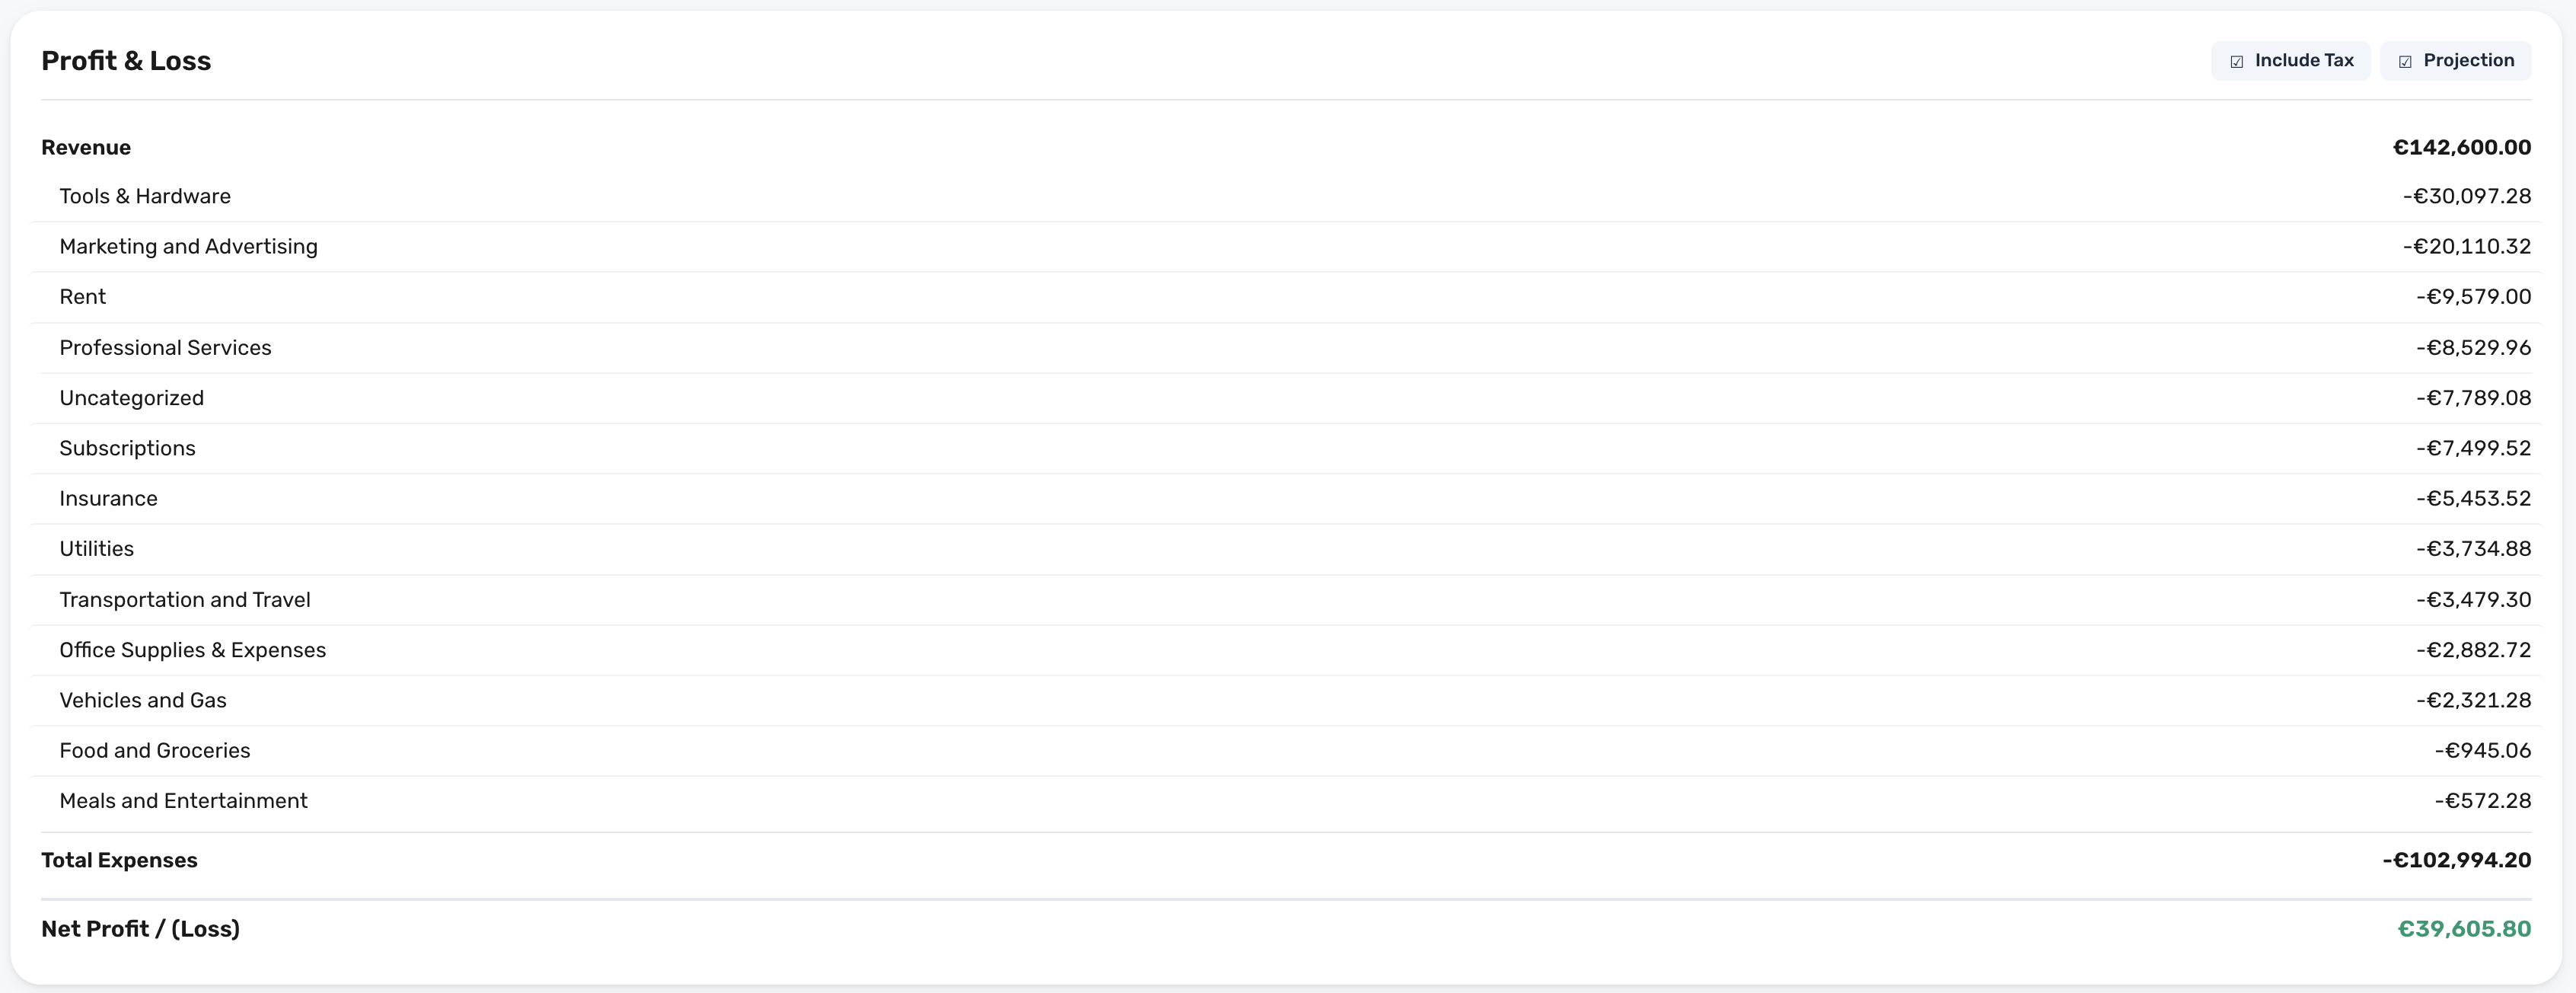
Shows income documents as Revenue, your expenses by Category, Total Expenses and Net Profit / (Loss) for the date range selected at the top of the view.
The widget has two modes:
-
Include Tax: include or exclude taxes from the shown values.
-
Projection: include future expenses and income from your recurring automations.
To print the P&L or keep it as a file, use Export (see below). SparkReceipt does not make a Balance sheet. See Can SparkReceipt make a Profit and Loss statement or a Balance sheet?
Expenses by Category widget
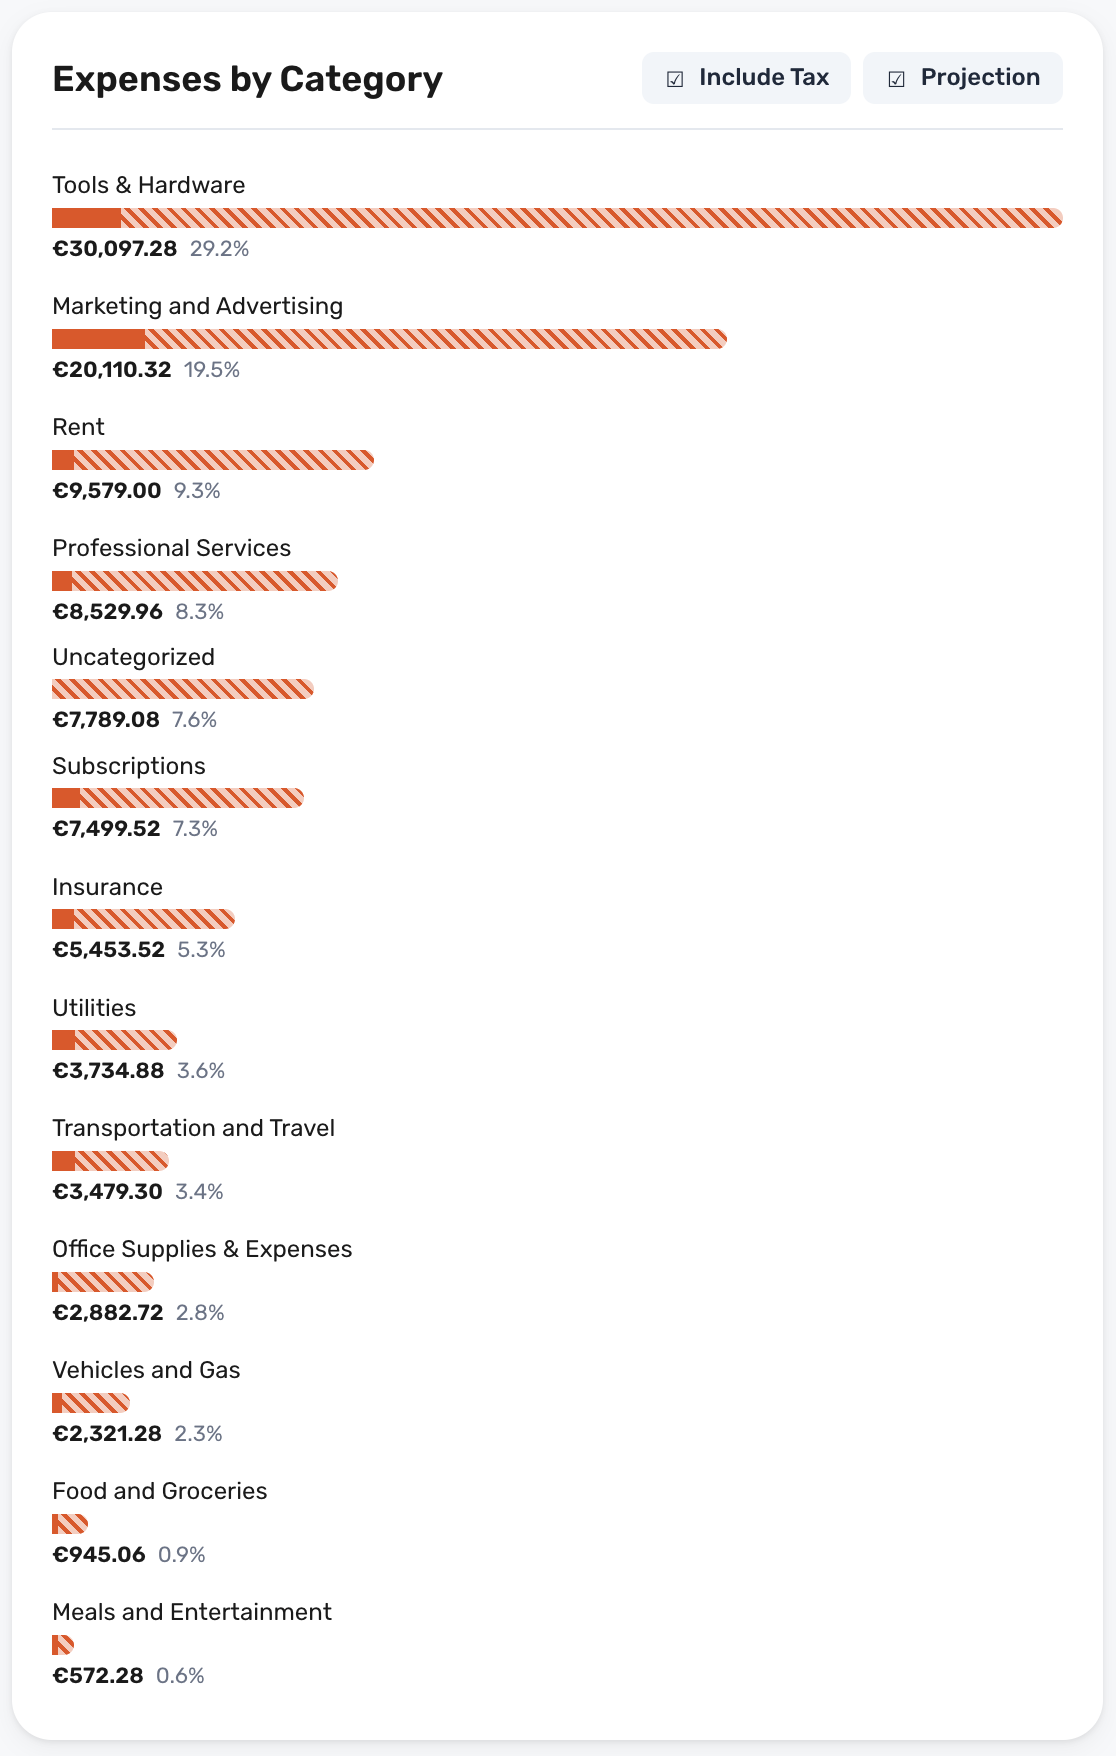
Shows expenses by category. Realized / past expenses shown with a solid fill and projected expenses with a striped fill.
Uses the date range selected in the top of the view.
The widget has two modes:
-
Include Tax: include or exclude taxes from the shown values.
-
Projection: include future expenses from your recurring automations.
Income by Category widget
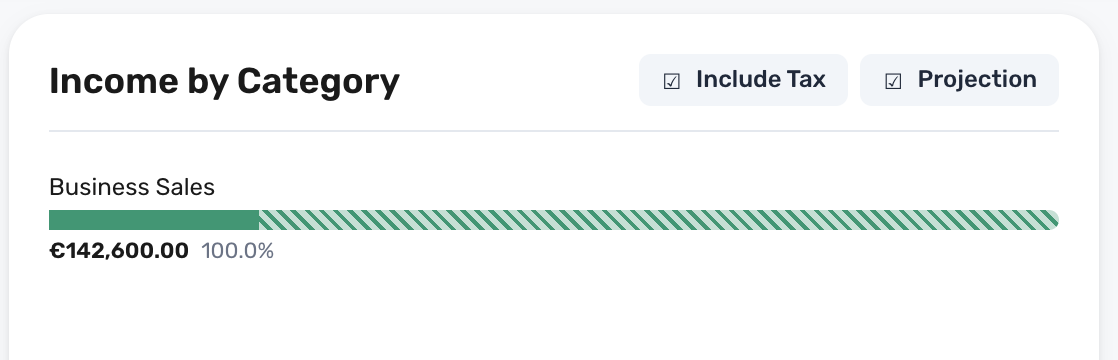
Shows income by category. Realized / past income shown with a solid fill and projected income with a striped fill.
Uses the date range selected in the top of the view.
The widget has two modes:
-
Include Tax: include or exclude taxes from the shown values.
-
Projection: include future income from your recurring automations.
Spending by User widget
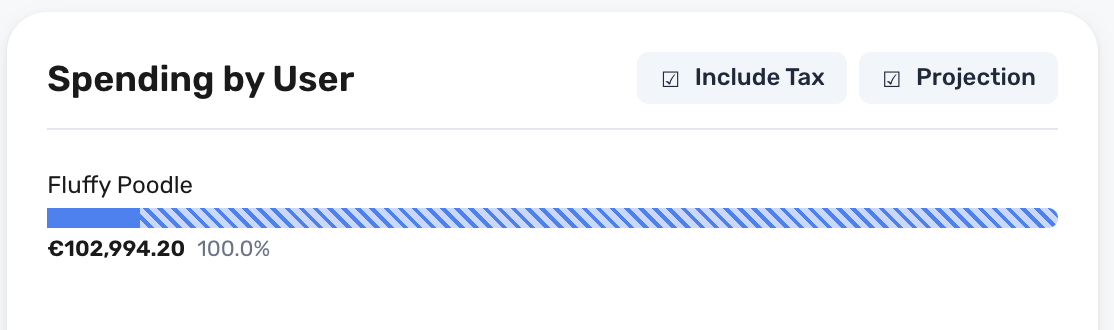
Shows spending by user. It is shown to members, admins, owners and accountants. Contributors see only their own documents on the Overview, so they don't get this widget.
Uses the date range selected in the top of the view.
The widget has two modes:
-
Include Tax: include or exclude taxes from the shown values.
-
Projection: include future expenses from your recurring automations.
Projections from recurring automations
Projection is off when you open the Overview. Turn it on in a widget to add the documents your recurring automations will create in the future. Projected amounts are shown separately from what has already happened (striped bars in the Category widgets).
A recurring automation shows up in the projection when all of these are true:
- The automation is turned on.
- Its next runs fall after today and inside the date range you picked. Runs up to today have already created real documents, which count as normal documents instead.
- The document it creates is an Expense or an Income. An automation without a document type is left out.
- It repeats daily or less often. Automations that run every minute or every hour are not projected.
- The person who set it up is still an active user on the account.
Projections are account-wide, so contributors, who see only their own documents, don't see them. If a recurring automation is missing from the projection, check those points first. You set up recurring documents with Make recurring on a document or under Automations in the settings. See How to set up automations in SparkReceipt.
Print or export the Overview
The Overview has no print button. To print it or send it to someone, click Export at the top of the Overview. The Export overview dialog creates an Overview summary: a PDF and an Excel file with the same figures as the page for the selected dates, downloaded together as a ZIP. Print the PDF from your computer.
The summary has tables for Profit and loss, Cash flow, Expenses by category, Income by category, Document types, Review status and, if you can see it, Spending by user. Amounts include tax, in your home currency, and projections are left out. The charts are not part of the file.
In the mobile app, tap Export next to the time period on the Home tab. The Export overview sheet creates the Overview summary for that period. To change more than the name, tap Open in report builder, which opens Create report with the Overview summary and the period's dates filled in.
You can also create an Overview summary from Reports > Create report by choosing Overview summary as the kind of report. See How to create reports in SparkReceipt.